This article also has a Chinese version.
Continue posting my previous work.
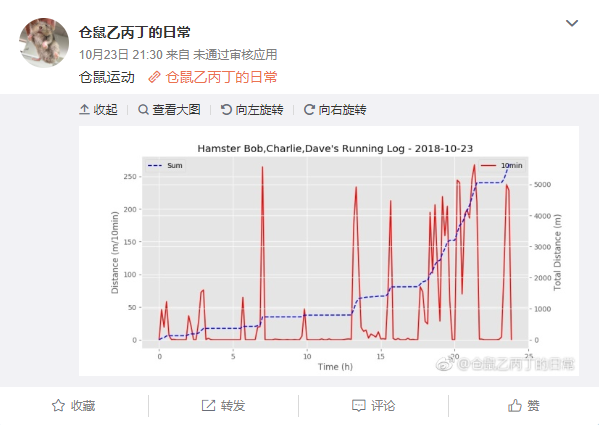
I kept three hamsters in the lab and thought about doing something interesting. The idea of daily tracking the rotation and time distribution of the hamsters’ running wheel and then posting this data to Weibo seemed like a fun endeavor.
Solution Design
I considered several solutions:
Optical camera: Too CPU-intensive for processing.
Digging a hole in the wheel and installing a transmitter and receiver on both sides of the hole: Complicated and needed precise alignment.
Equipping the wheel with a microswitch: Prone to destruction by hamsters and difficult to replace.
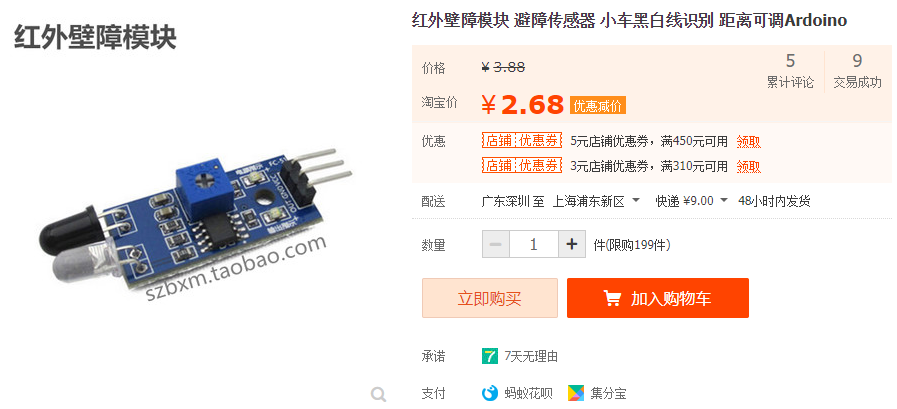
During my search for sensors, I came across an obstacle avoidance sensor. Although intended for avoiding obstacles, its working principle, I believed, was based on infrared reflection. The strength of optical reflections not only depends on the distance but also on the nature of the reflecting surface. Therefore, it should be possible to obtain rotation data by detecting periodic changes in the wheel’s surface.
DIY
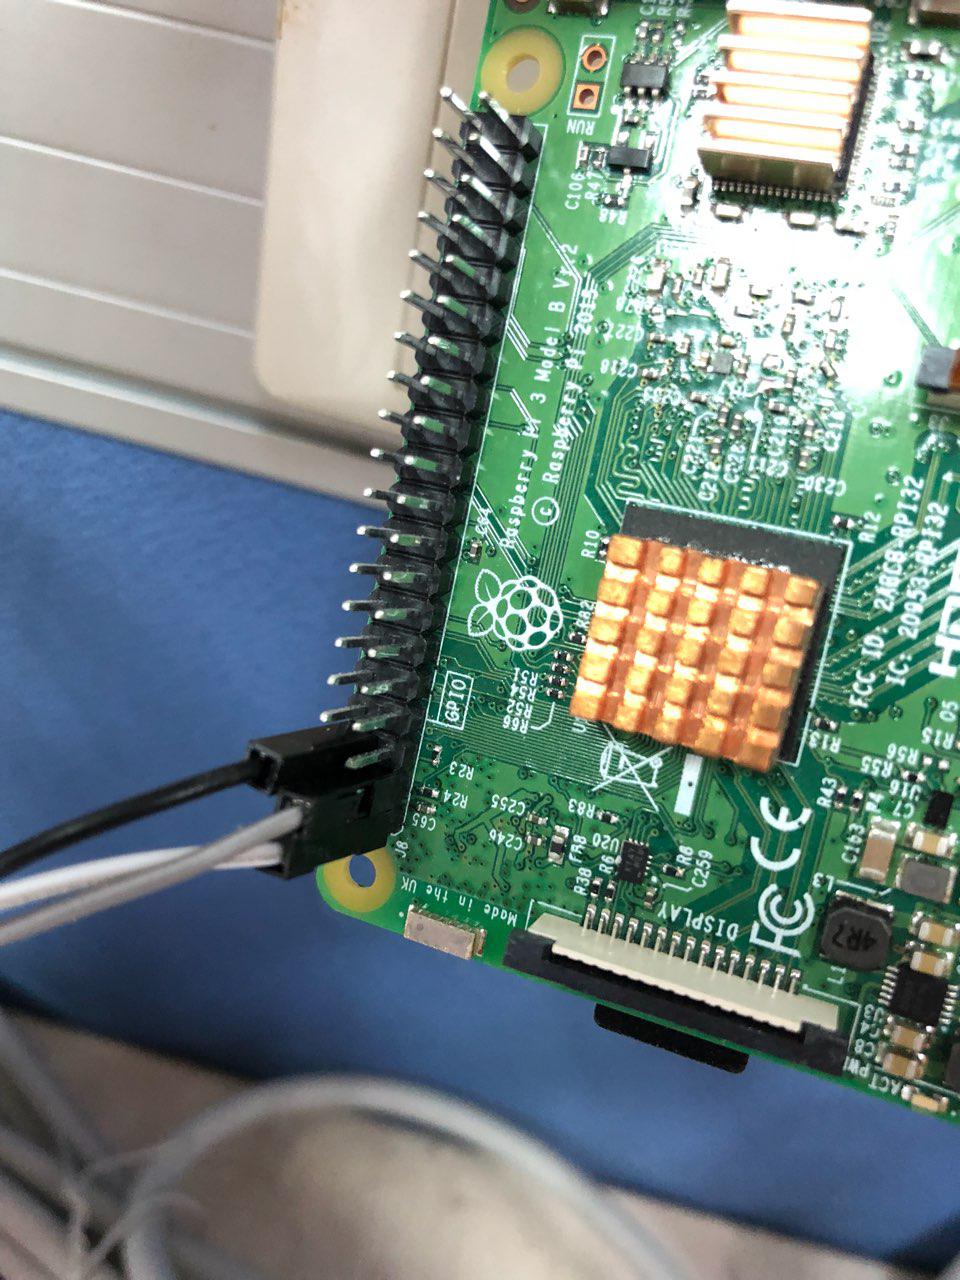
I spent 2 yuan on Taobao for a 3.7V obstacle avoidance sensor to connect to the Raspberry Pi.
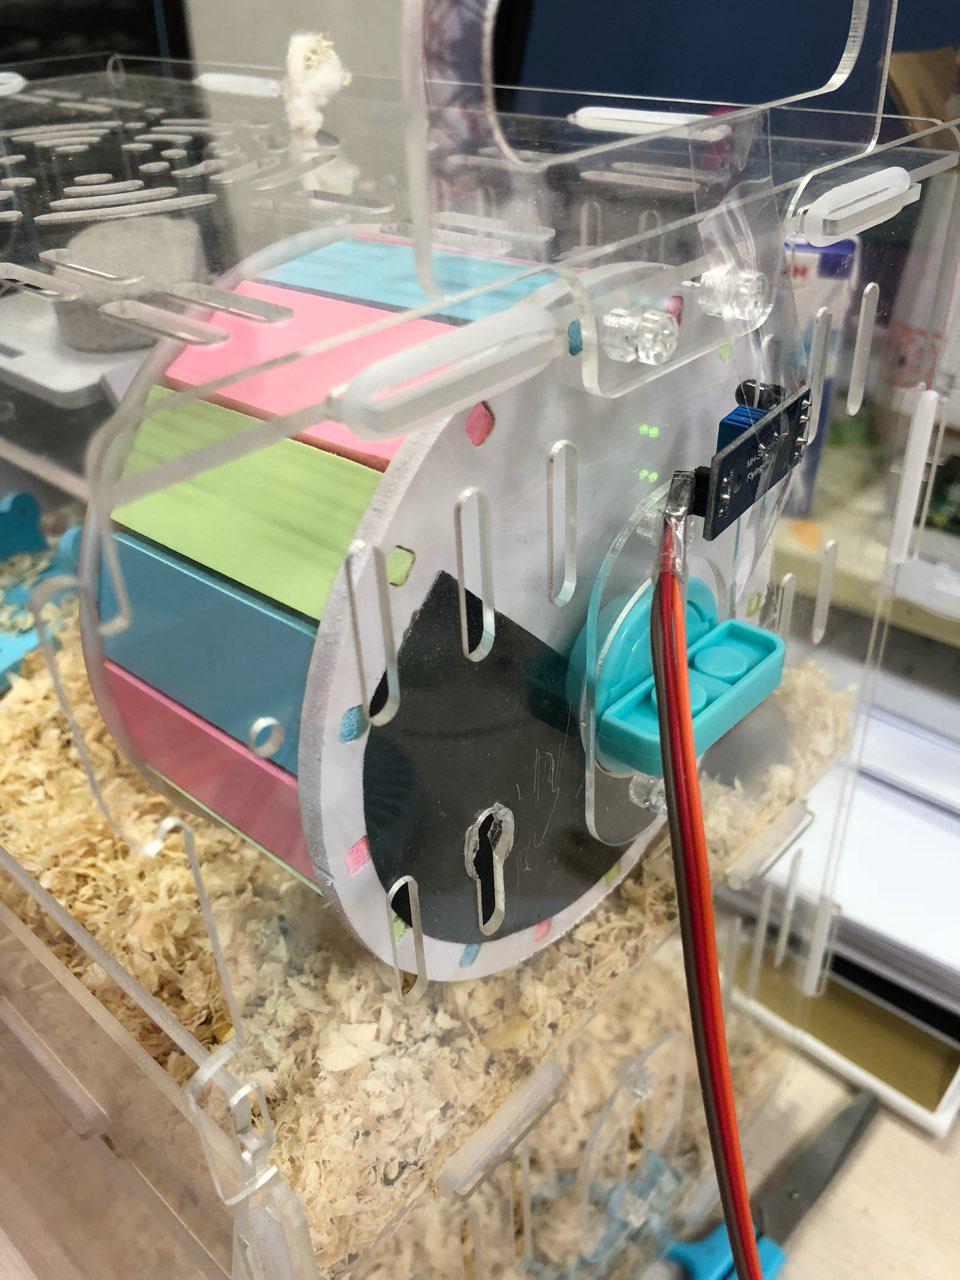
I tried sticking a silver plastic sheet on the wheel, and indeed it worked. But the sticker wasn’t smooth enough, causing signal glitches at the edges.
Later on, I found a black whiteboard marker and painted a section of the wheel. Since the contrast between black and white is higher than that between white and silver, I was able to obtain more stable data. The sensor outputs a low level when aligned with the black portion and a high level when aligned with the white portion. A single high-to-low or low-to-high transition corresponds to one revolution of the wheel.
For the software portion, I just needed to detect the GPIO pin corresponding to the sensor’s output. To avoid bogging down the Raspberry Pi, I wrote the code in Golang and used the GoBot library to simplify signal processing.
Incoming sensor signals are dispatched to a buffered channel to prevent prolonged blocking from affecting the next signal input. Meanwhile, another goroutine collects data from the channel and writes the collected data to the database at certain time intervals.
For the database, I used InfluxDB, which is friendly to time-series data.
Visualization
With this setup, each revolution of the wheel writes a timestamp entry into the database.
However, data needs to be visualized and published to be presented in a user-friendly manner.
I used matplotlib for data visualization and saved the images to post them via the Weibo API after visualization.
Follow my hamsters here: https://weibo.com/cangshucangshu
For the full code, see: https://github.com/ihciah/HamsterRunning
Sad news (2018/10/24):
My supervisor found out I was raising hamsters in the lab…